Visuals speak louder than words—and no, we’re not just being dramatic. Here’s a stat that’ll blow your mind: the human brain processes visuals 60,000 times faster than text! Think about what that could mean for your business—especially when you’re trying to capture attention and communicate info quickly.

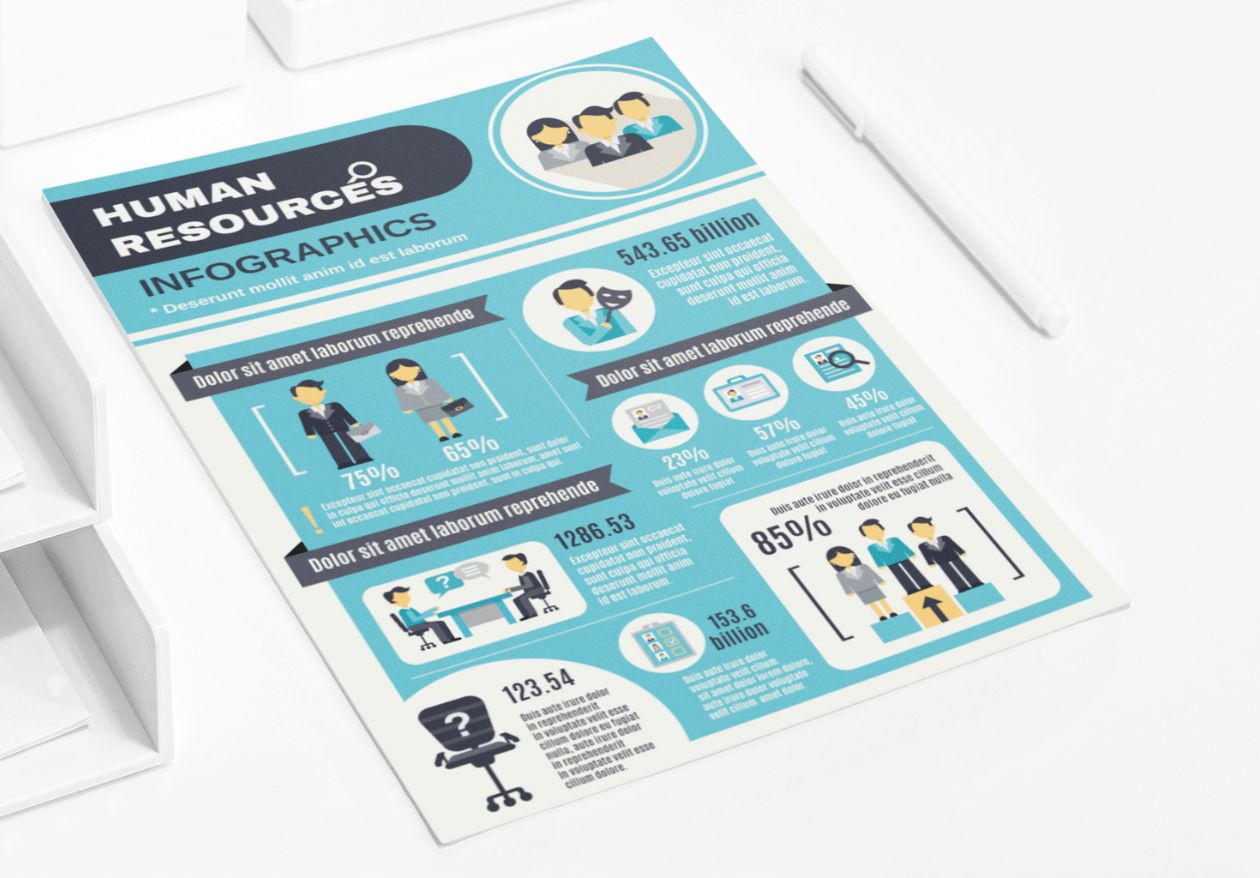
Enter infographics. These beautifully designed gems simplify complex information, making it easier (and way more fun) for your audience to understand what you’re trying to say. They’re not just pretty pictures—they’re powerful communication tools.
If you’re a small business owner, learning to harness the power of infographics will open up endless possibilities for improving your overall communication, marketing strategy, and brand storytelling.
The Power of Visuals in Communication
Visuals can convey messages quickly, effectively, and in a way that resonates deeply with your audience.
Why Your Brain Loves Visuals
Here’s a fun fact to chew on: 90% of information transmitted to the brain is visual. It’s no wonder humans are drawn to visuals like a moth to a flame—they make everything faster and easier to process. Unlike chunky paragraphs of text, infographics present information in bite-sized, digestible chunks that are much friendlier to our (very busy) brains.
And there’s more. Research shows that people retain 65% of information when presented visually, compared to just 10% when it’s shared through text alone. Translation? Your audience is more likely to remember your message when it’s wrapped up in a stunning infographic.
Visuals Drive Engagement
Have you ever noticed how posts with images perform better on social media? Well, infographics take this to a whole new level. They’re eye-catching, easy to share, and naturally encourage engagement—think likes, shares, and comments. Whether it’s on Instagram, Facebook, or LinkedIn (hey, even in email), infographics are your secret weapon for grabbing attention and driving interaction.
The Art of Brand Storytelling
Every business has a story to tell; it’s how you connect with customers and differentiate yourself from the competition. Infographics do more than just show data—they help tell your brand story in a way that’s compelling, memorable, and easy to follow. With the right colors, graphics, and flow, your infographic can be the visual representation of your brand at its best.
Pro Tip: Use your brand colors and fonts in your infographics wherever possible. Consistent visuals = stronger branding!

Creating Effective Infographics for Your Small Business
Follow these 6 steps to create infographics that wow!
1. Identify Your Target Audience
Before you start designing, ask yourself this question: Who am I speaking to?
Understanding your audience’s needs, preferences, and pain points will help you craft content that resonates with them. An infographic for coffee lovers would look very different from one for tech enthusiasts—so tailor your approach accordingly!
2. Choose the Right Data Points
Infographics are all about delivering value, but you need to be picky with your data. Choose statistics, facts, or trends that are:
- Relevant to your audience.
- Supporting your main message.
- Genuinely interesting! Nobody likes boring data.
(Side note: Verify your sources. Credibility matters!)
3. Keep It Simple and Clear
We know it’s tempting to cram everything into one infographic, but less is more. Stick to a single message or idea, use concise language, and guide your audience through the infographic with a logical flow.
4. Prioritize Visual Appeal
This is where the magic happens. To make your infographic look as good as its data feels:
- Invest in high-quality visuals.
- Use a clean, balanced layout.
- Stick to a consistent color palette.
5. Test and Tweak
Once your infographic is ready, test it out with friends, colleagues, or even your social media followers. Is the flow clear? Does it look professional? Use their feedback to fine-tune your design for maximum impact.

Using Infographics in Your Marketing Strategy
Now that you’ve got the design basics down, here’s how to work infographics into your marketing strategy.
Social Media Marketing
Social media loves visuals, and infographics are particularly good at driving engagement. Whether it’s a quick explainer or fun stats about your industry, share your infographics on platforms like Instagram, Facebook, and LinkedIn for maximum exposure.
Blog Posts & Articles
Infographics break up long blocks of text and make blog posts easier (and faster) to read. They’re perfect for summarizing your key points or presenting complex information in a simple way.
Website Content
A great infographic doesn’t just educate your audience—it can also improve your website traffic. Visuals are known to increase dwell time (how long people stay on your site), which can boost your SEO rankings. And don’t forget the share buttons—encourage people to spread the infographic love!
Presentations & Pitches
When preparing for a big client meeting or investor pitch, Infographics can illustrate key results and insights much more clearly than paragraphs or pie charts. You’ll look prepared, professional, and way more polished.
Real-World Infographic Examples
Here are some businesses that nailed it with their infographic designs.
- “Facebook Psychology” Infographic:
This Nowsourcing infographic is a great example because it totally nails the iconic Facebook vibe—clean, modern, and super relatable to its topic. We’re usually in the “less is more” camp when it comes to font choices, but here—it works. The mix of fonts actually adds a quirky, almost frantic energy that somehow keeps you locked in as you scroll through the longer content. - “The Best Careers for Your Personality Type” Infographic:
This infographic from Truity is a color-lover’s dream! It uses four vibrant shades to group 16 personality types in a way that’s both easy to follow and fun to look at. Plus, it sneaks in a little color psychology to bring out the core vibe of each group. The big takeaway here is that colors don’t just make things pop—they can tell a story. Use ‘em wisely, and suddenly your infographic isn’t just pretty; it’s smart, too. - “Style Your Home With Feng Shui” Infographic:
See that blue/beige pattern? It’s not just there to look pretty. Nope, it’s subtly shaped like a downward arrow, gently nudging your eyeballs to keep scrolling down. And when you hit the last section, surprise—it flips the script and gives you a little lift, casually pointing you toward the website for more info. Arrows aren’t just for road signs; use them to guide your viewers through your design.
Final Thoughts
Infographics are a powerful way to simplify complex information and connect with your audience in a visually engaging format. Whether you’re highlighting trends, explaining data, or promoting services, a well-designed infographic can make a lasting impact. If you’re ready to elevate your visual strategy, contact Moonlit Media today, and let’s create infographics that captivate, inform, and drive results for your business!